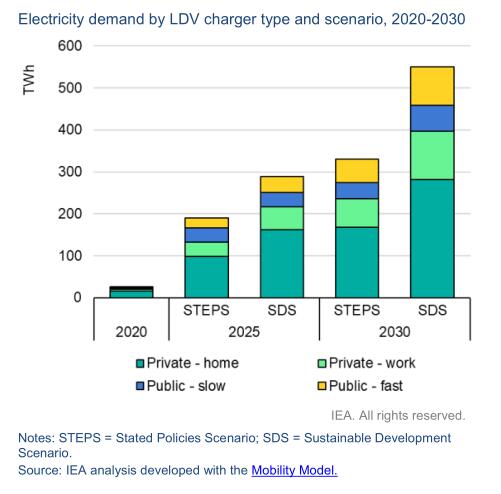
EVs require access to charging points, but the type and location of chargers are not exclusively the choice of EV owners. Technological change, government policy, city planning and power utilities all play a role in EV charging infrastructure. The location, distribution and types of electric vehicle supply equipment (EVSE) depend on EV stocks, travel patterns, transport modes and urbanisation trends.
These and other factors vary across regions and time.
• Home charging is most readily available for EV owners residing in detached or semi-detached housing, or with access to a garage or a parking structure.
• Workplaces can partially accommodate the demand for EV charging. Its availability depends on a combination of employer-based initiatives and regional or national policies.
• Publicly accessible chargers are needed where home and workplace charging are unavailable or insufficient to meet needs (such as for long-distance travel). The split between fast and slow charging points is determined by a variety of factors that are interconnected and dynamic, such as charging behaviour, battery capacity, population and housing densities, and national and local government policies.
The assumptions and inputs used to develop the EVSE projections in this outlook follow three key metrics that vary by region and scenario: EVSE-to-EV ratio for each EVSE type; type-specific EVSE charging rates; and share of total number of charging sessions by EVSE type (utilisation).
EVSE classifications are based on access (publicly accessible or private) and charging power. Three types are considered for LDVs: slow private (home or work), slow public and fast/ultra-fast public.
Private chargers
The estimated number of private LDV chargers in 2020 is 9.5 million, of which 7 million are at residences and the remainder at workplaces. This represents 40 gigawatts (GW) of installed capacity at residences and over 15 GW of installed capacity at workplaces.
Private chargers for electric LDVs rise to 105 million by 2030 in the Stated Policies Scenario, with 80 million chargers at residences and 25 million at workplaces. This accounts for 670 GW in total installled charging capacity and provides 235 terawatt-hours (TWh) of electricity in 2030.
In the Sustainable Development Scenario, the number of home chargers is more than 140 million (80% higher than in the Stated Policies Scenario) and those at workplace number almost 50 million in 2030. Combined, the installed capacity is 1.2 TW, over 80% higher than in the Stated Policies Scenario, and provides 400 TWh of electricity in 2030.
Private chargers account for 90% of all chargers in both scenarios in 2030, but for only 70% of installed capacity due to the lower power rating (or charging rate) compared to fast chargers. Private chargers meet about 70% of the energy demand in both scenarios, reflecting the lower power rating.
Publicly accessible chargers
There are 14 million slow public chargers and 2.3 million public fast chargers by 2030 in the Stated Policies Scenario. This accounts for 100 GW of public slow charging installed capacity and over 205 GW of public fast installed capacity. Publicly accessible chargers provide 95 TWh of electricity in 2030. In the Sustainable Development Scenario, there are more than 20 million public slow chargers and almost 4 million public fast chargers installed by 2030 corresponding to installed capacities of 150 GW and 360 GW respectively. These provide 155 TWh of electricity in 2030.
Post time: May-05-2021

